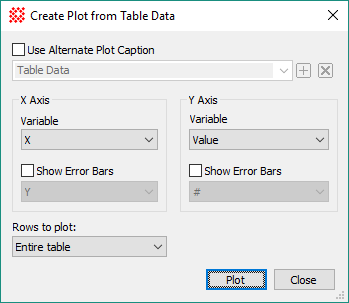
Create Plot from Grid
The Create Plot from Grid command creates a Plot Window scatter plot from data in two columns of a Measurement Pane or Report Window. The chart axis names are taken from the column headings of the Grid Control. An example using this command is given in Tutorial: Making a Scatter Plot of Measurements. Also see the related Create Chart from Grid command. The word "Plot" in this command is used to refer to Plot Windows, where the plot will appear.
Open the Create Plot from Grid command dialog from the View menu for Report Windows or use the Grid Context Menu (open the menu by right-clicking inside the Report Window).
|
Properties of the Create Plot from Grid dialog |
|
|
|
Check this box to use a specified caption instead of a default caption created from the axis label names. |
|
X Axis Group |
|
|
Variable |
Select the variable to be plotted on the Horizontal ("X") axis. The names in this box are column headings in the Grid Control. |
|
|
Check this box and select the grid column to use for X-direction error bars. |
|
Y Axis Group |
|
|
Variable |
Select the variable to be plotted on the vertical ("Y") axis. The names in this box are column headings in the Grid Control. |
|
|
Check this box and select the grid column to use for Y-direction error bars. |
|
Rows to Plot |
Select which rows to include in the chart: Entire Table: Selects all rows in the table. Selected Rows: Selects only the marked rows. Note: If the table does not allow individual rows to be selected, this setting reverts to using the entire table. |
|
Plot |
Creates the plot in a Plot Window using the selected properties. |
The columns listed in the 4 selection boxes are taken from the Measurement Pane or Report Window. This is the window owning the menu from which you opened the Create Plot from Grid dialog.
Error bars are plotted only if their enabling check-boxes are checked; if not checked, the particular columns selected in the error list boxes are ignored.
The Caption specifies the title to be drawn immediately above the plot box. This uses a history control to provide access to captions you may have used in the past.
Report windows have 2 modes for selecting which rows to plot: The entire table or only selected rows.
All rows are used if no specific rows are selected.
Only selected rows are used if selected in Row Selection Mode. See Grid Controls and the Grid Context Menu.
Making a scatter plot is a 1 or 2 step process, depending upon whether you want to plot values from all rows of the table (one step process) or you want to plot values only from selected rows (two step process). In the two step process, the rows must be selected in the Report Window (see row selection under Grid Context Menu). In both cases, the data columns are selected from among the columns of the table. To plot the entire table, use one of the two methods shown below. To plot data only in selected rows, you must first select the rows before executing the Create Plot from Grid command; see Selecting Cells in a Grid Control.
The Plot Window below compares the Y coordinate ("Y") versus X coordinate ("X") from the table of Point Measurements for an image.
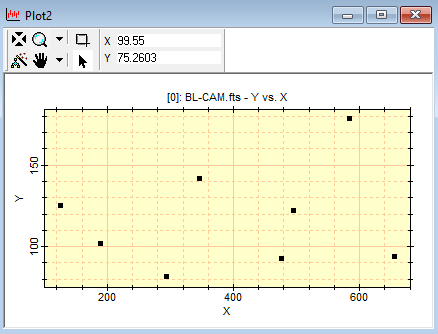
Making a Scatter Plot of Measurements
Mira Pro x64 User's Guide, Copyright Ⓒ 2023 Mirametrics, Inc. All
Rights Reserved.