![]() Plot Point
Measurements
Plot Point
Measurements
The Plot Point Measurements tool marks
points in a Plot
Window. The commands in the point plotting package originate in
a docking pane toolbar that may be opened, closed, and tabified.
The plot series and point coordinates are accrued in the
Points grid pane for the plot window. The toolbar opens with
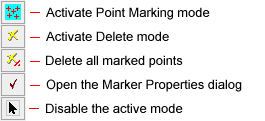
Marking Mode active. Marker properties are set in the
Marker
Properties dialog opened from the ![]() button on
the toolbar. To disable the active marking mode, use the arrow
button at the bottom of the pane.
button on
the toolbar. To disable the active marking mode, use the arrow
button at the bottom of the pane.
To activate the Point Measurements
toolbar, click ![]() on the Image Measurements
Toolbar or the Plot
Bar, or use the command in the pull-down main menu for Plot
Windows.
on the Image Measurements
Toolbar or the Plot
Bar, or use the command in the pull-down main menu for Plot
Windows.
The following picture shows a Plot Window with several points marked on the graph. This picture shows each of the markers available from the Shape Properties page of the Marker Properties dialog. The point measurement results accrue in the Points Docking Pane at the bottom of the Plot Window. To reduce the screen space used by the Points pane, use its stick-pin to tabify it on the Plot Window border.

The point data are tabulated in the Points grid like the one shown above. This is a Docking Pane that attaches initially to the bottom border of the Plot Window but may be moved, tabified, and so on. The results listed in the grid may be sorted, rearranged, saved to the clipboard or a file, and so on. The items in this report are described in the table below.
Points Measurements
|
# |
The sequence number of the point in its series. |
|
Plot |
The title of the plot. |
|
Index |
The sequence number of the point measurement. |
|
X |
The X coordinate of the point. |
|
Y |
The Y coordinate of the point. |
|
Notes |
Space to add comments about the measurements. These will be included if you export the table to a text file. |
Mira Pro x64 User's Guide, Copyright Ⓒ 2023 Mirametrics, Inc. All
Rights Reserved.