![]() Creating
a Line Profile
Creating
a Line Profile
A Line Profile Plot is made by drawing a line on an image displayed in an Image Window. There are several options that determine the plotted data and its appearance on the Image Window. Options include using world coordinates and centroiding on the endpoints. The following is an example of a line profile plot:
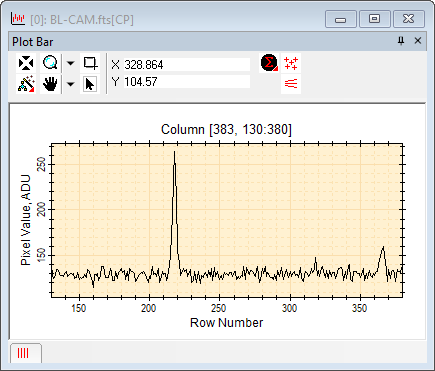
Notice that the plot X AXIS shows distance rather than coordinates. The line plot is generally drawn at an angle, so it has no attachment to either column or row coordinates.
This command can be operated from a Window Toolbar
or from a Menu extending from the ![]() button on the Image Plot Toolbar.
button on the Image Plot Toolbar.
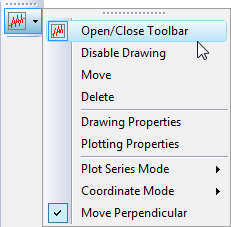
Note that additional commands are available from
the drop button next to the ![]() button
on the main Image
Plot Toolbar.
button
on the main Image
Plot Toolbar.
Be sure the target Image Window is on top of the Window Stack and has focus. Adjust image magnification and position so you can see the region you want to plot.
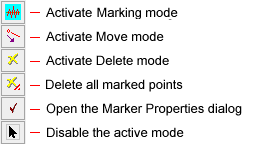
Enable Marking Mode using one of these methods:
On the main Image Plot Toolbar, click ![]() .
.
If the Line Profile Toolbar is already open, click ![]() to enter Marking mode.
to enter Marking mode.
On the Image Context menu, select Plot > Line Profile.
Move the mouse pointer to the first image point and click mouse down.
Drag the rubber band line to the final image point and release the mouse button. The line profile plot appears in a new Plot Window.
To add an another plot series for the profile at an offset position, enter move mode, grab the line, and move it to a new location. The plot will add to the window where you release the mouse button. This is described below. See Adding Series to a Line Profile Plot.
The Plot Window below shows further processing by adding statistics for the plot series.
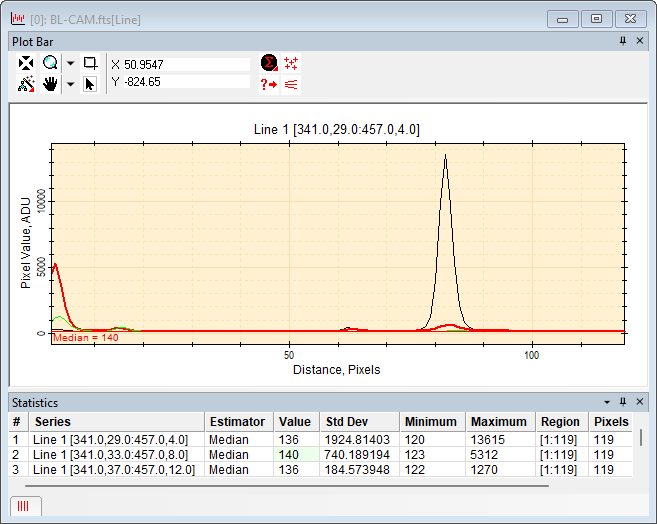
The illustration above was created using the steps below. This procedure marks several plot series in the Plot Window which are shown with different colors and line thicknesses. These are specified as follows:
The series color and line thickness are specified before making the plot in the Image Plot Properties dialog.
The series color and line thickness may be changed after making the plot using the Plot Series Properties dialog.
Bring the target Image Window to the top of the window stack.
Open the Line Profile Toolbar using the button on the main toolbar or the Plot > Line Profile Toolbar command in the main menu
On the Line Profile Toolbar, select Marking mode and draw the first profile line on the image.
On the toolbar, enter Move mode. Grab the first profile line and move to a new location. Release the mouse at the new location.
Repeat step 2 at a third location. Steps 2 and 3 have created a total of 3 plot series in the Plot Window.
Select a statistic to compute for all plot
series: To open the statistics selection, either right-click the
![]() on the Plot Bar or use the the Measure
> Statistics Properties submenu from the main Plot Window menu at the top
of the Mira desktop. In the Statistics Properties dialog, select the
statistic and set its parameters as needed.
on the Plot Bar or use the the Measure
> Statistics Properties submenu from the main Plot Window menu at the top
of the Mira desktop. In the Statistics Properties dialog, select the
statistic and set its parameters as needed.
Click the ![]() button to
compute the statistics for all plot series. The Statistics pane
will open containing the measurements.
button to
compute the statistics for all plot series. The Statistics pane
will open containing the measurements.
In the Statistics pane, left-click on the statistic you want to draw in the plot window. In this example, the median statistic was selected for series # 2. The target grid cell is highlighted in green.
In the Statistics pane, right-click on the series you want to mark, then select Mark Statistic from the pop-up menu.
To plot a different statistic, repeat steps 7 through 9.
Adding Series to a Line Profile Plot
Mira Pro x64 User's Guide, Copyright Ⓒ 2023 Mirametrics, Inc. All
Rights Reserved.