The View > Properties > Statistics menu for Image Windows and Plot Windows;
The Properties
command in the drop-menu of the ![]() button on the
Measurements
Toolbar;
button on the
Measurements
Toolbar;
The right-click mode of the ![]() button on the Plot Window's Plot Bar.
button on the Plot Window's Plot Bar.
Statistics Properties
The Statistics Properties dialog configures parameters for Statistics Measurements in Image Windows and Plot Windows. Mira keeps two sets of parameters, one for image windows and the other for plot windows. The Statistics Properties dialog makes a distinction between these two sets when opened from either type of window. For example, if image windows and plot windows are both visible on the Mira desktop, then the parameter set opened and saved corresponds to the Image Window or Plot Window that has the focus (the "top-most" window with the active title bar).
Sample value estimators like Mean, Median,MTM Sigma Clipped Mean, etc., automatically calculate the standard deviation. Non-value estimators, like Minimum, Skewness, etc., do not. The standard deviation and standard error estimators duplicate the estimator as the standard deviation.
Most of the statistical estimators are also available for combining and normalizing images. See Statistical Estimators for Image Combining.
The Statistics Properties dialog is opened from several locations:
The View > Properties > Statistics menu for Image Windows and Plot Windows;
The Properties
command in the drop-menu of the ![]() button on the
Measurements
Toolbar;
button on the
Measurements
Toolbar;
The right-click mode of the ![]() button on the Plot Window's Plot Bar.
button on the Plot Window's Plot Bar.
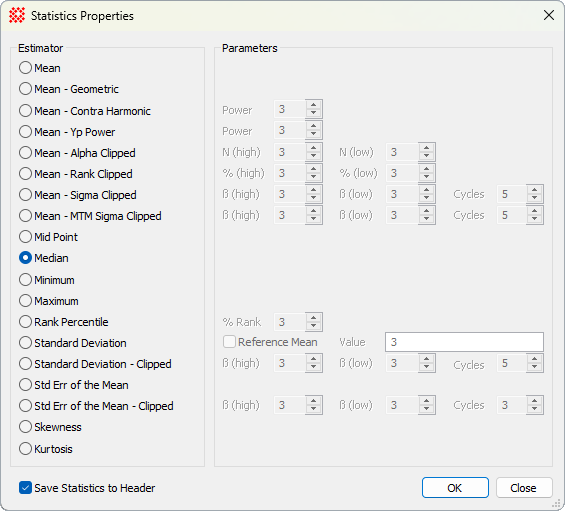
Several of the estimators have Parameters that control their calculation. The specific parameters are enabled when their Estimator bullet is selected.
|
Properties of the Statistics Properties dialog |
|
|
Mean |
Calculates the simple average with no weighting or rejection of bad values. |
|
Mean - Geometric |
Calculates the geometric mean, which is a mean value weighted by the reciprocal of the individual values. |
|
Mean - Contra Harmonic |
Calculates the weighted harmonic mean value in which each weight involves the value raised to the p power. |
|
Mean - Yp Power |
Calculates the weighted mean value in which the weight is given by the exponent "p", which is the value raised to the p power. |
|
Mean - Alpha Clipped |
Calculates a clipped mean in which a specified number N(high) and N(low) values are excluded from the sample. |
|
Mean - Rank Clipped |
Calculates a clipped mean in which the specified percentiles %(high) and %(low) of values are excluded from the sample. |
|
Mean - Sigma Clipped |
Calculates a clipped mean in which values are rejected if more deviant than ß(high) and ß(low) above and below the sample distribution mean. Refinement of the calculated mean value is repeated up to specified maximum number of cycles. Use this method when calculating the mean value in the presence of deviant values that are outliers from a Normal distribution. |
|
Mean - MTM Sigma Clipped |
Calculates a clipped mean in which values are rejected if more deviant than ß(high) and ß(low) above and below the sample distribution estimator. This computation includes both the mean and median values of the sample distribution. Refinement of the calculated mean value is repeated up to specified maximum number of cycles. Use this method when calculating the mean value in the presence of deviant values that are outliers from a Normal distribution. |
|
Mid Point |
Calculates the midpoint between the sample minimum and maximum values. |
|
Median |
Calculates the sample median (50th percentile). |
|
Minimum |
Calculates the minimum values of the sample. |
|
Maximum |
Calculates the maximum values of the sample. |
|
Rank Percentile |
Calculates the ranked percentile value based on the %Rank parameter. For example, if %rank = 50, then the 50th percentile, or median, value is returned. |
|
Standard Deviation |
Calculates the Standard Deviation about the mean value. To calculate the standard deviation about a specified value, check the Reference Mean box and enter the target value. Otherwise, the ordinary standard deviation is calculated. |
|
Standard Deviation - Clipped |
Calculates the Standard Deviation in which values are rejected if more deviant than ß(high) and ß(low) above and below the sample distribution mean. Refinement of the calculated mean value is repeated up to specified maximum number of cycles. Use this method when calculating the standard deviation in the presence of deviant values that are outliers from a Normal distribution. |
|
Std Err of the Mean |
Calculates the Standard Error of the Mean. This is the standard deviation divided by the square root of the number of points in the sample, also known as the "error of the mean." This statistic is used when comparing the mean values for two different populations, such as the mean value of one image to the mean value of another image. Comparatively, the standard deviation measures the variation (or "scatter") of the sample values (e.g., pixels) with respect to their own mean. |
|
Std Err of the Mean - Clipped |
Calculates the Standard Error of the Mean in which values are rejected if more deviant than ß(high) and ß(low) above and below the sample distribution mean. Refinement of the calculated mean value is repeated up to specified maximum number of cycles. Use this method when calculating the standard deviation in the presence of deviant values that are outliers from a Normal distribution. This is the standard deviation divided by the square root of the number of points in the sample, also known as the "error of the mean." This statistic is used when comparing the mean values for two different populations, such as the mean value of one image to the mean value of another image. Comparatively, the standard deviation measures the variation (or "scatter") of the sample values (e.g., pixels) with respect to their own mean. |
|
Skewness |
Calculates the statistical skewness to characterize the asymmetry of the sample distribution. Skewness greater than 0 indicates a positive bias and skewness less than 0 indicates a negative bias. |
|
Kurtosis |
Calculates the relative weight of central values to tail values in the sample distribution. The value is adjusted to a reference value of 0 for the Normal ("Gaussian") distribution. A kurtosis value greater than 0 indicates that the distribution is taller than a Normal distribution (too narrow, or "leptokurtic"). Conversely, a kurtosis value less than 0 indicates the distribution is flatter than a Normal distribution (too flat, or "platykurtic"). By definition, the Normal distribution has the reference ratio of central area to tail area adjusted to 0, and is called "mesokurtic". |
|
|
Check this box to save the statistics measurements as FITS keywords in the image header. This feature is available when the dialog is opened for an Image Window but not for a Plot Window. See "Saving Statistics to the FITS Header," below. |
|
[OK] |
Saves the changed parameters and closes the dialog. |
|
[Cancel] |
Closes the dialog without saving the changed parameters. |
The computed statistics can be saved to the FITS image header for documentation purposes or for further analysis. For example, you might need to assess how the CCD dark current varies with CCD temperature across a series of dark frames. An example is given in the tutorial Using FITS Keywords to Analyze Image Data.
The table below lists the FITS keyword names used for representing statistics measurements in the image header. This keyword is a coded version of the estimator name, a consequence of the 8 character maximum length of FITS header keywords. For example, the Mean - Sigma Clipped estimator is abbreviated to make the keyword name S_SCMEAN. If the estimator also uses parameters, as does Mean - Sigma Clipped which has ß(high), ß(low), and Cycles parameters, then these parameters are saved in the Comment field of the keyword. Note that the S_REGION keyword is always saved to the header as it contains the column and row region over which the most recent estimator was calculated.
The S_REGION keyword is updated with the new measurement region when any statistic is added to the header.
Estimators are added to the FITS header using keyword names listed in the table below. If the keyword already exists in the header, its value is updated with the new value. Otherwise, a new keyword line is added to the header.
Statistics keywords are NOT permanently saved to the image file unless you save the image using one of the File > Save commands. All such commands are shown in the picture of the File Save Image Set menu.
To remove all statistics keywords from the image header, use the menu command Measure > Statistics Properties > Remove Statistics Keywords.
If an image set is opened in the target Image Window, the Process Image Set flag controls whether the keywords are removed from the current image or the entire image set. See the Image Window Properties dialog and the [P] button on the Image Bar.
The FITS keyword abbreviations below follow a few mnemonic rules. First, all begin with "S_". In addition, clipped estimators use the letters "CL" or "C", depending on the total number of characters in the name.
|
FITS Keywords for Statistical Estimators |
|
|
FITS Keyword |
Statistic (see table above) |
|
S_REGION |
Specifies the column and row limits of the region, for example, [150:351,128:762] |
|
S_MEAN |
Mean |
|
S_GOMEAN |
Mean - Geometric |
|
S_CHMEAN |
Mean - Contra Harmonic |
|
S_YPMEAN |
Mean - Yp Power |
|
S_ACMEAN |
Mean - Alpha Clipped |
|
S_RCMEAN |
Mean - Rank Clipped |
|
S_SCMEAN |
Mean - Sigma Clipped |
|
S_MTMEAN |
Mean - MTM Sigma Clipped |
|
S_MIDPT |
Mid Point |
|
S_MEDIAN |
Median |
|
S_MIN |
Minimum |
|
S_MAX |
Maximum |
|
S_RANK |
Rank Percentile |
|
S_SDEV |
Standard Deviation |
|
S_CLSDEV |
Standard Deviation - Clipped |
|
S_SERR |
Std Err of the Mean |
|
S_CLSERR |
Std Err of the Mean - Clipped |
|
S_SKEW |
Skewness |
|
S_KURT |
Kurtosis |
Mira Pro x64 User's Guide, Copyright Ⓒ 2023 Mirametrics, Inc. All
Rights Reserved.