Scatter Plot
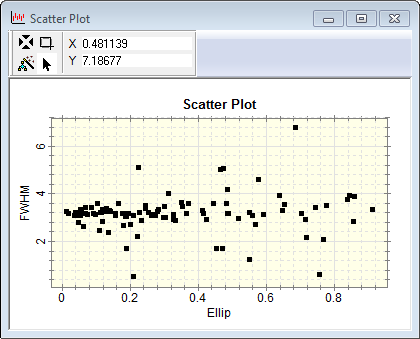
The Scatter Plot command graphs the data from two columns in a Report Window. The command also can add X and Y direction error bars to the plot as shown below, taken from the MExtract tutorial:
The Scatter Plot command loads the column titles from the target (i.e., top-most) Report window and then allows you to select which columns to graph. See Tutorial: Making a Scatter Plot of Measurements.
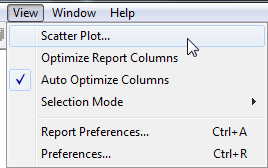
Open the Scatter Plot command dialog from the View pull-down menu for Report Windows or use the Report Context Menu (open the menu by right-clicking inside the Report Window).
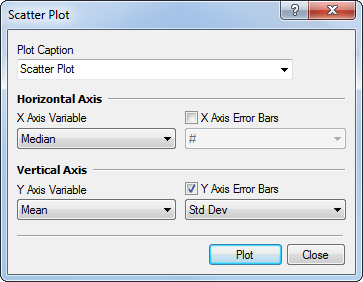
The columns listed in the 4 selection boxes dialog are taken from the top-most Report Window. This is the window from which you opened the Scatter Plot dialog.
Error bars are plotted only if their enabling check-boxes are checked; if not checked, the particular columns selected in the error list boxes are ignored.
The Caption specifies the title to be drawn immediately above the plot box. This uses a history control to provide access to captions you may have used in the past.
Report windows have 2 modes for selecting which rows to plot: The entire table or only selected rows.
All rows are used if no specific rows are selected.
Only selected rows are used if selected in Row Selection Mode. See Selecting Cells in a Report Table and Report Context Menu.
Making a scatter plot is a 1 or 2 step process, depending upon whether you want to plot values from all rows of the table (one step process) or you want to plot values only from selected rows (two step process). In the two step process, the rows must be selected in the Report Window (see row selection under Report Context Menu). In both cases, the data columns are selected from among the columns of the table. To plot the entire table, use one of the two methods shown below. To plot data only in selected rows, you must first select the rows before executing the Scatter Plot command; see Selecting Cells in a Report Table.
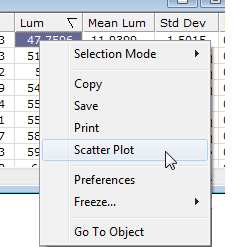
After choosing whether to plot all rows or selected rows, open the Scatter Plot command: Inside the target Report Window, right click anywhere on the grid to open its Report Context Menu
|
|
|
|
Right-click on the Report Window to open its context menu, then select Scatter Plot |
Click on the View menu to expose the Scatter Plotcommand. |
Plotting Commands, Report Windows, Selecting Cells in a Report Table, Making a Scatter Plot of Measurements, Plot Windows