Selecting Cells in a Report Table
Mira Report Windows contains a table of data or measurements. Some commands that work with the table, such as Copy and Scatter Plot, can use the entire table or use data only in specific cells of the table. To work with specific cells, those cells must be "selected". A table cell is "selected" when it is marked, or highlighted. Marking cells in a table works essentially the same way you select files from the Open dialog or you select cells in Microsoft Excel. Cell selection is started by pressing the left mouse button down on the starting cell, then you drag to the last cell in the block. However, there are some variations on this basic theme which add capability to commands that work with table data.
The pull-down View menu for Report Windows and the Report Context Menu both contain a popup menu named Selection Mode. The Selection Mode provides 3 modes of selection for marking cells:
Single: allows only single cells to be selected at one time. This means that the entire table is used by commands.
Multiple: allows a rectangular block of cells to be selected.
Row: allows entire rows to be selected.
The Multiple and Row modes allow more than one cell to be selected at one time. The basic procedure for marking multiple cells involves pressing the left button down on the first cell (left button down and hold), then dragging the mouse to the final cell.
You can also add cells that are not touching a marked block by using the Windows standard [Ctrl] key modifier. Here are the rules for marking multiple cells in Multiple Mode or Row Mode:
To mark a block of cells, mouse down on the starting cell, then drag the mouse to the final cell. Release the mouse button at the final cell
To begin marking an additional block of cells, press the [Ctrl] key before pressing the left mouse button down on the starting cell. With [Ctrl] pressed, click on the starting cell and repeat rule (1).
Repeat rule (2) to mark each additional block.
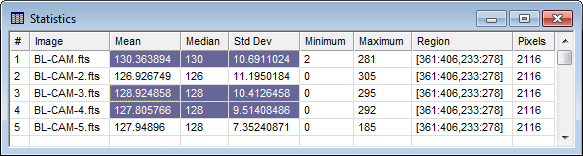
Using these rules, you can mark any group of cells in the table. For example, the picture below shows a Statistics Report with 3 blocks selected using these rules:
Here is the recipe for marking 3 rows of cells as shown in the picture above:
RIght click on the report table to open the Report Context Menu. Select Selection Mode > Multiple.
Mouse-down on "130.363894" and drag right to "10.6911024". Release the mouse to mark the first block.
Press and hold [Ctrl]. Then mouse-down on "128.924858" and drag downward and to the right to "9.51408486". Release the mouse to mark the second block.
If you were to use the Copy command in the menu, only these 2 groups of cells would be copied to the Windows clipboard.
Marking rows works the same as for marking cells in Multiple Selection Mode, except that clicking anywhere in a row marks the entire row. Dragging the mouse in Row Selection Mode marks a block of rows. You can mark separate blocks of rows using the [Ctrl] key as described above.
|
Note |
To use the Scatter Plot command to plot specific rows of data, you must use Row Selection Mode, not Multiple Selection Mode to mark the target rows. |
Report Windows, Report Context Menu, Exporting Report Data, Tutorial: Making a Scatter Plot of Measurements