 This
brief illustrates some of the 3-D visualization capabilities in
Mira Pro x64. Here, we show how Mira's 3-D visualization tools can be used to better
understand numerical models that are part of almost any academic or
R&D imaging application.
This
brief illustrates some of the 3-D visualization capabilities in
Mira Pro x64. Here, we show how Mira's 3-D visualization tools can be used to better
understand numerical models that are part of almost any academic or
R&D imaging application.
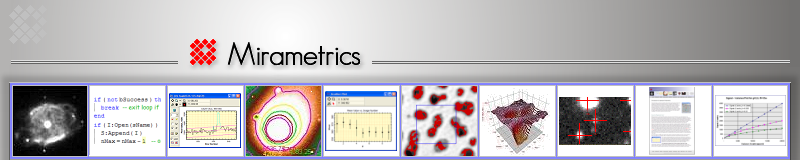
Loading Data into Mira for Rendering
To load your model data into Mira, you need to know only its width, height, and numeric data type. Your model doesn’t need to be written to any particular image format, and Mira supports real and integer arrays ranging from 8 to 64 bits per pixel. Once the 2-D array is opened in Mira, a superb 3-D rendering is just a button click away. To help understand your model, you can move the viewpoint around the data, change the characteristics of the light source, switch to an intensity rendering, even apply a pseudo-color palette as a function of array value or reflectivity. If that’s not sufficient, you can set the view rotating while you scrutinize its topology. And, if you need, say, 3 copies rotating simultaneously but viewed from different elevations, then that too is easy to do. Mira provides an intuitive control interface that quickly becomes second nature so that playing with buttons and sliders doesn’t get between you and understanding your data. Oh, and if you need those classy renderings for your records or in a report… no problem. As we’ve done here, your 3-D rendering can be quickly copied and pasted from Mira into a standard Microsoft® Word document or similar medium.
|
|
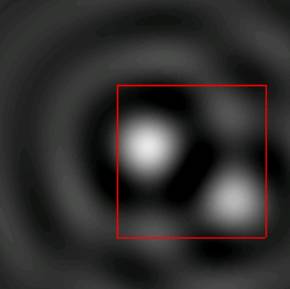
Figure 1.This 2-D image shows a 201 x 201 pixel mathematical model consisting of a simple array of double precision numbers. The red rectangle defines the region of interest to be rendered in 3-D. Generating a 3-D plot is as simple as stretching the cursor to enclose the region, followed by clicking the surface plot button. |
|
|
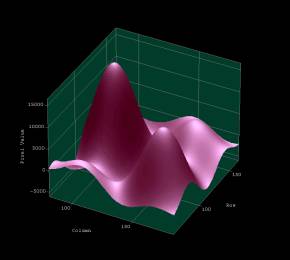
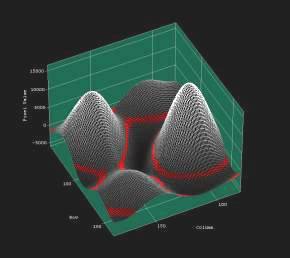
Figure 2.Surface plot with Phong shaded rendering. The light source is above and slightly to the right of the observer. The stock “lavender” palette supplied with Mira was applied |
|
|
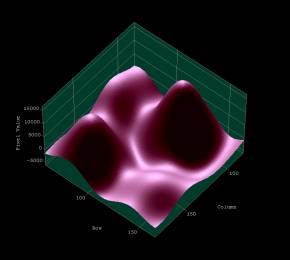
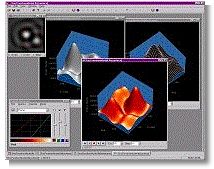
Figure 3.This view shows the above rendering with the viewpoint rotated 90º clockwise and to higher elevation. The light source was also raised to shine more directly down onto the surface. At this position, the light source begins to reveal the subtle topology of the minima in the model. |
|
|
Figure 4.This view shows the surface plot from above after switching to intensity shaded rendering. This maps the array values into a palette, and is known as a "4-d plot". The stock “level slice” palette supplied with Mira was used to show isopleths of constant array value as well as information about the range of values. The “thickness” of the highlighted range can be adjusted as needed. |
|
Figure 5.4-d rendering as in Figure 4, above, but with grid overlay enabled. In this mode, both the grid and the surface are mapped from image luminance to palette intensity. The grayscale palette shows a monotonic function of array value. |
|
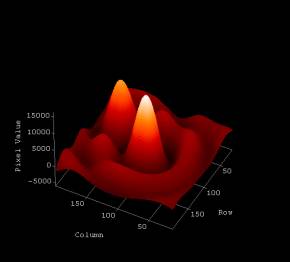
Figure 6.This illustration shows the entire image rendered as a 4-d intensity plot. The overlay grid was disabled and the stock “flame” palette was applied.
|
|
|
Figure 7.In this illustration, the coordinate planes and base plane were disabled. The entire coordinate grid can be disabled to show only the surface itself. |
|
|
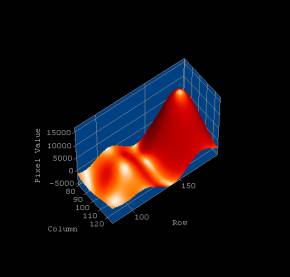
Figure 8.This view shows a Phong shaded surface rendering of a narrow strip from the center to the bottom of the 2-D image. The light source was raised in elevation and the Gloss parameter increased to accentuate the sharpness of local maxima in the model’s parameter space. |
|
|
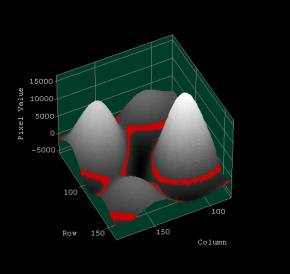
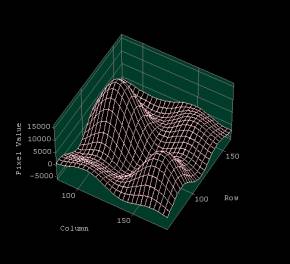
Figure 9.Of course, Mira also does simple wireframe plots. This plot was made using the sub-sampling command. The surface was sampled every 4th point over the region outlined in the 2-D image. Sub-sampling produced a coarser grid and is especially useful when rendering large surfaces. This plot uses “uniform” shading in which the array value is not mapped into a color palette. |
|
|
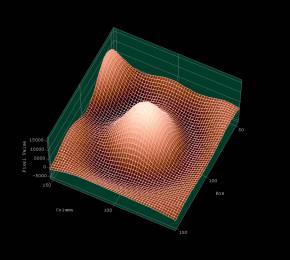
Figure 10.This illustration shows the central region of the 2-D image as a 4-d rendering (an intensity shaded surface plot with an overlaid grid). Mira’s stock ”copper” palette was applied as a function of array value. |