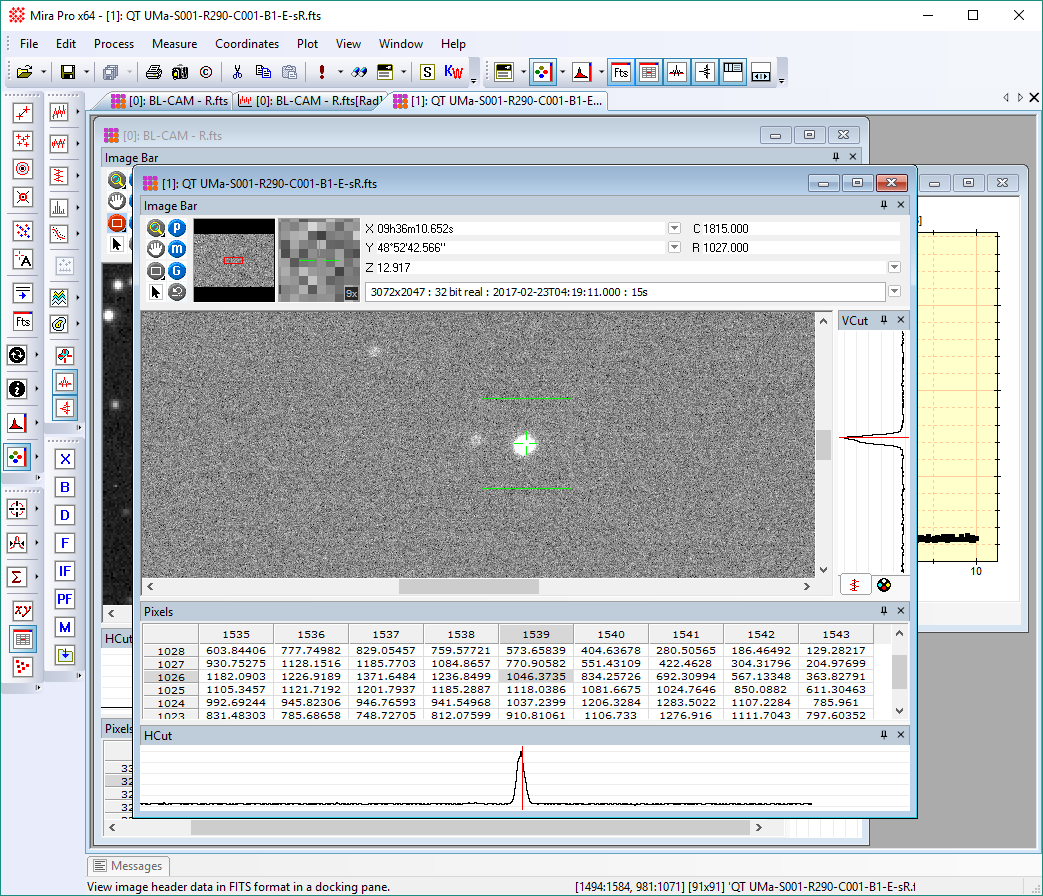
The screenshots below shows simple but intuitive pixel analysis using live readout in Mira Pro x64 and Mira MX x64. The tools in these 4 docking panes provide a quick, dynamic view of image pixels, including image and world coordinates, central pixel value, a table of surrounding values, and line plots in both horizontal and vertical directions. Of course, Mira offers several other ways to interrogate pixels, such as contour plots, 3-D surface plots, line plots, histograms, point measurements, etc. Coordinate readout occurs in the Image Bar at top, itself a docking pane.
Cursor readout moves with the image cursor (rectangular and green, in this example), which itself is moved by roaming the mouse or using keyboard arrow keys. Mira is very efficient, so all update at full speed as the image cursor is moved, or the image is zoomed or panned. The individual panes are displayed or hidden using buttons on the Image Pane toolbar at the top of the Mira screen.
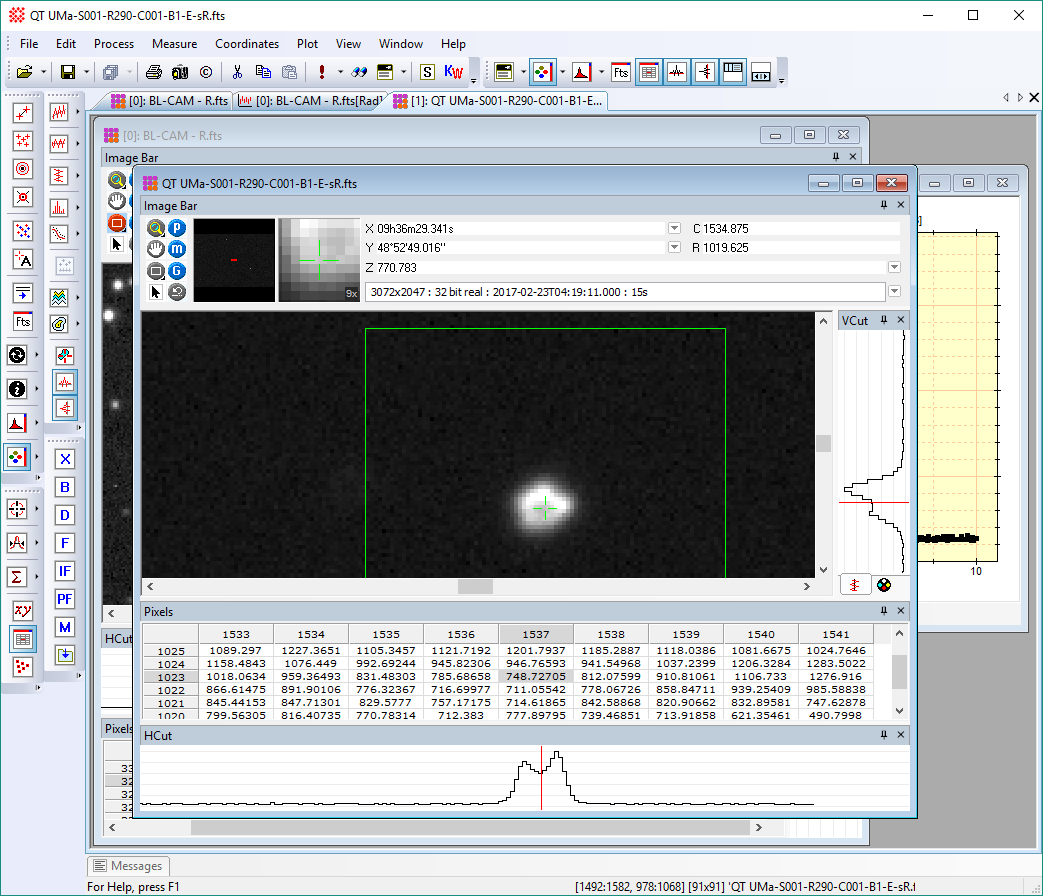
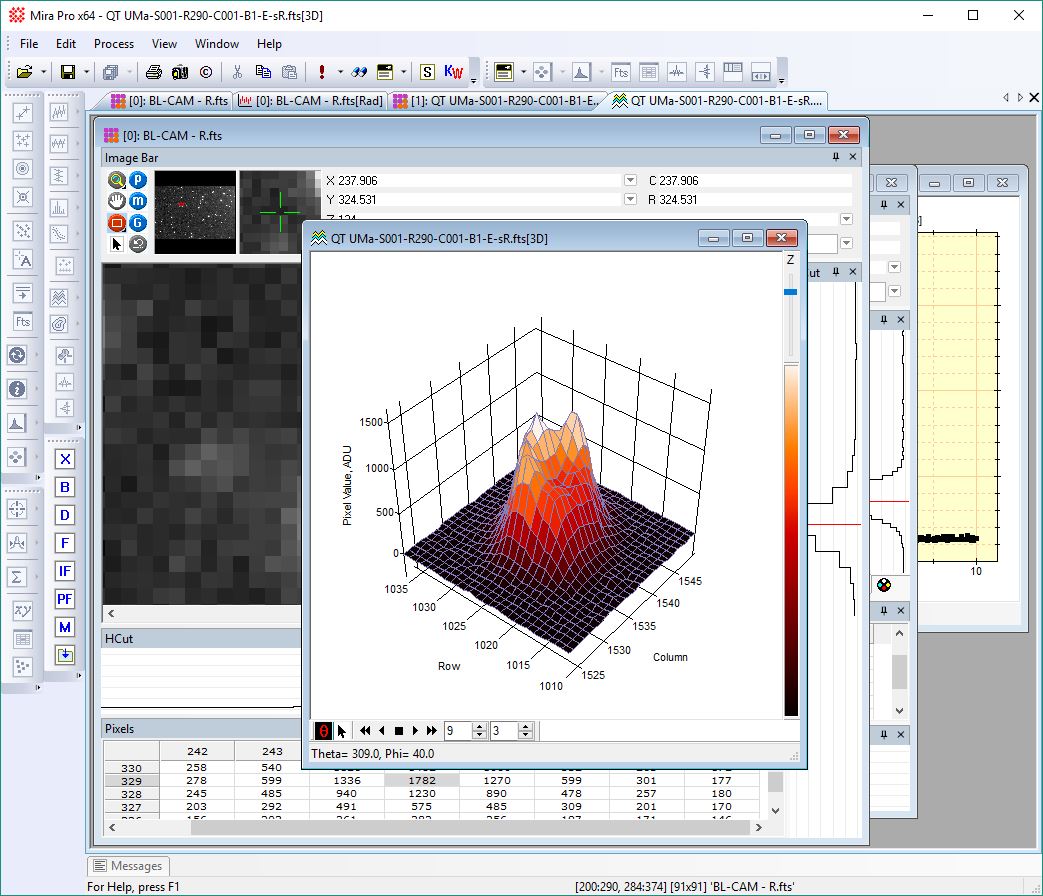
The left screenshot below shows the image at 1x zoom with the transfer function scaled to the entire image. Although the star profile is saturated in the image view, the intensity slices show an asymmetry in the point spread function. The middle screenshot shows the image zoomed to show detail on the point profile and with the transfer function changed to emphasize pixels inside the green image cursor. Notice the blobs and a central hole showing at least an issue with the image focus. At right is a 3-D surface plot showing a clearly defocused image. (Click the thumbnails to open full-size images in another tab).