Tutorial: Introduction to Aperture Photometry
This tutorial describes the procedure for making a simple photometric measurement using Mira's Aperture Photometry package. This tutorial assumes you understand how to display an image and do elementary operations like moving the image cursor. To get a quick start on displaying images, see Tutorial: Displaying an Image. A separate tutorial describes how to do Time Series Photometry. One application area for time series photometry is finding the time of minimum brightness for variable stars and other objects; for this application, see the Kwee - van Woerden Solver command.
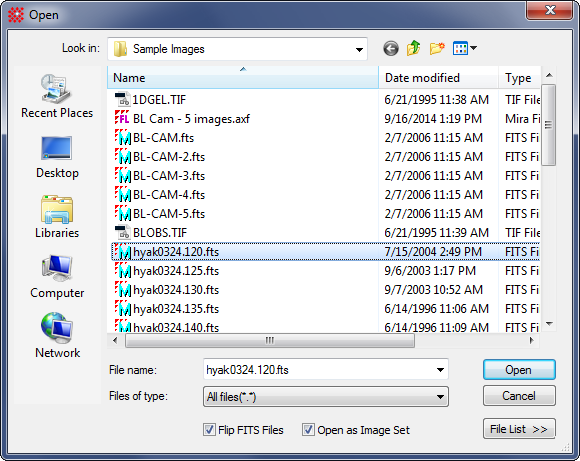
To begin, click File > Open on the menu to open the familiar Open dialog. In the Open dialog, select the image shown below and click [Open].
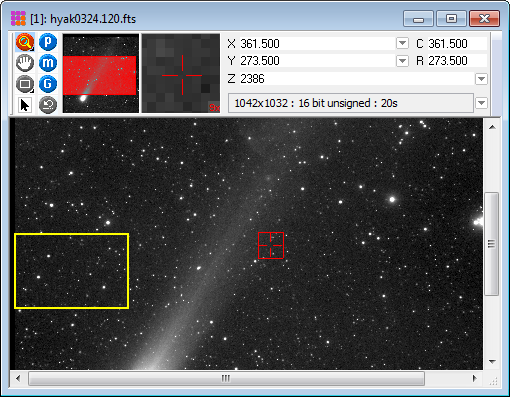
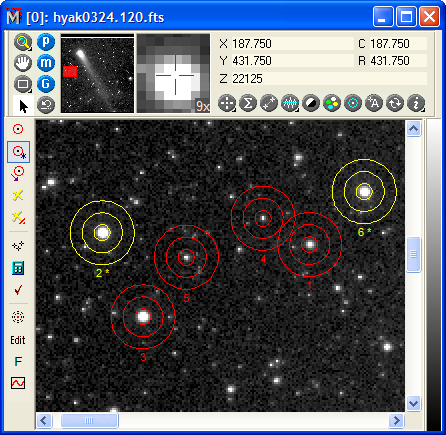
The image opens as shown below, with theImage Bar at the top of the window. The yellow rectangle shows the part of the image used in this tutorial.
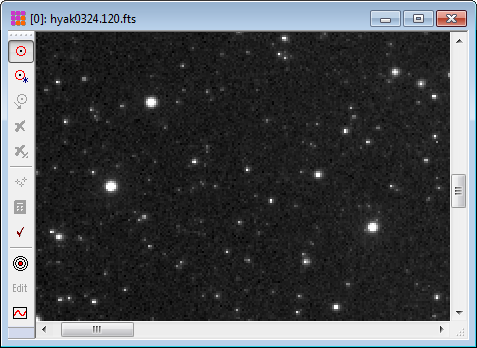
To get more space without showing theImage Bar at the top of the
window, right click on the image and select Configure > Image Bar from the menu to close
the Image Bar (you can re-open it the same way). Adjust the
position and magnification to show the field of view below (for
help with magnifying, see Magnifying the Image). On the main Image Measurements
Toolbar, click the photometry button ![]() to open the Aperture
Photometry Toolbar on the left border of the image window.
to open the Aperture
Photometry Toolbar on the left border of the image window.
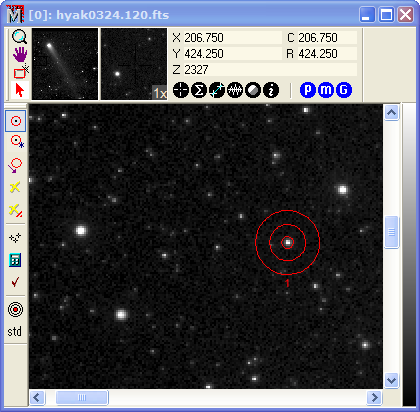
Before measuring a star, we want to magnify a portion of the field so that it looks like the view shown below
Now click ![]() on the main
toolbar. This displays the Aperture Photometry Toolbar on
the left border of the window (see picture below).
on the main
toolbar. This displays the Aperture Photometry Toolbar on
the left border of the window (see picture below).
In this tutorial, we are measuring a single image, but Mira can measure any number of images displayed as an image set. Before starting photometry, it is important to know that each image contains information needed for calculating magnitudes and their errors (uncertainties). These quantities, stored in the image header, are the exposure time, electronic gain, and readout noise, and they are stored as the keywordsEXPTIME, GAIN, and RDNOISE. If these keywords are not in each image header, or the values are not correct, then you need to add or edit them. Mira provides a way to do this efficiently, even for many images in an image set; see Fixing Header Problems in Photometric Data. You also can have Mira substitute aliases for the standard keywords; see Photometry Keywords.
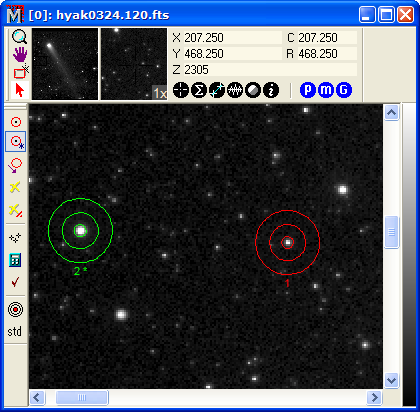
Now move the mouse pointer to near coordinate (160,458) and click the left mouse button. Mira computes a centroid position near this point and draws a marker on the star near where you clicked:
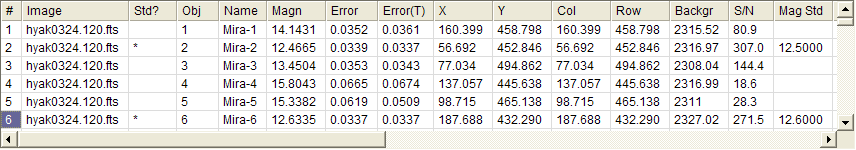
The magnitude is reported with other information in the Photometric Measurements Report Window shown below. This Report Window lists more than 20 columns of data but we see only the first few in this example. To show more, you can adjust the data table using the scrollbar. See Photometric Measurement Definitions to learn more about this these quantities.
In the Photometric Measurements window shown above,
notice that the magnitude is a large negative number. This results
from the definition of magnitude as -2.5 log (flux) and the fact
that a photometric zero point has not yet been applied (see
Aperture
Photometry). We will use a standard star to calculate the zero
point. On the Aperture Photometry Toolbar, click ![]() to enter standard star marking mode, then click
on the standard star. In this case, move the mouse onto the star
near coordinate (57,453) and click to mark the object. This opens
the Standard Data dialog:
to enter standard star marking mode, then click
on the standard star. In this case, move the mouse onto the star
near coordinate (57,453) and click to mark the object. This opens
the Standard Data dialog:
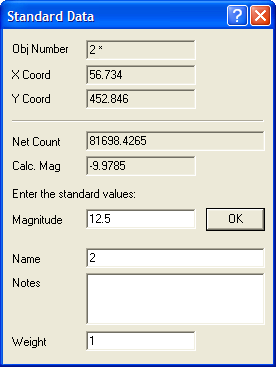
Into the Standard Data dialog, enter the star's magnitude and a statistical weight. You can leave the weight at the default of 1. If you are doing "ensemble photometry", you may wish to use another weight value based on the magnitude or the magnitude uncertainty of the standard star. For the star you just marked, enter 12.5 for the magnitude and click [OK] to accept the value. The image window updates like this:
Notice that the standard star has an ID number with
an asterisk (*) beside it; this is used in the photometry report to
show that the measurement was made of a standard star. If the
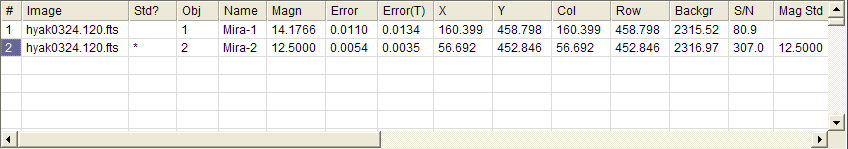
magnitudes in the table are still negative after marking a standard
star, click ![]() to compute and apply the
photometric zero point. The table now has positive magnitudes.
Notice that the standard star you marked has the magnitude 12.5000
that you entered:
to compute and apply the
photometric zero point. The table now has positive magnitudes.
Notice that the standard star you marked has the magnitude 12.5000
that you entered:
To see more data for these measurements, use the horizontal scrollbar. Two photometric error estimates are listed in the report: Error and Error(T). These are the empirical (measured) uncertainty and the theoretical uncertainty for the calculated magnitude. Mira also saves the photometric zero point and its uncertainty to the image header (see ZERO-PT and ZERPTERR keywords in the table of FITS Keywords), but these values are not saved to files unless you save the images using File > Save or an equivalent command. With the zero point saved in the image header, you can do photometry on another occasion and the magnitude measurements will automatically be convert raw to instrumental values with the zero point applied.
Now let us return to measuring magnitudes. Click
![]() on the toolbar to switch to
Marking Mode. Click 3 more stars as
shown below, and then switch to Standard mode. Mark object 6 as a
second standard star and enter the value 12.62 for its magnitude,
then click [OK] to close the
dialog.
on the toolbar to switch to
Marking Mode. Click 3 more stars as
shown below, and then switch to Standard mode. Mark object 6 as a
second standard star and enter the value 12.62 for its magnitude,
then click [OK] to close the
dialog.
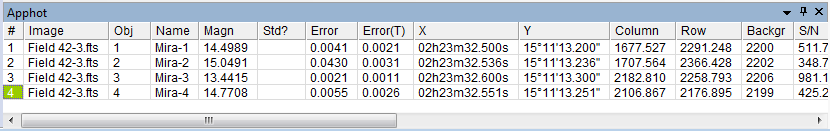
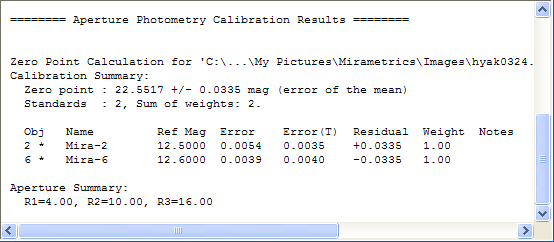
Now click ![]() to recalculate the
zero point using 2 standards. This produces the table below. Notice
that the two standard stars now have magnitudes that are not the
same as the values you entered. This happens because their
magnitudes are calculated using the zero point value. Each standard
star now has a residual, which is the difference between its
calculated magnitude and its predicted magnitude based on the
photometric zero point. The residuals are listed in one of the
columns to the right of the table (you will have to use the
horizontal scrollbar to view it).
to recalculate the
zero point using 2 standards. This produces the table below. Notice
that the two standard stars now have magnitudes that are not the
same as the values you entered. This happens because their
magnitudes are calculated using the zero point value. Each standard
star now has a residual, which is the difference between its
calculated magnitude and its predicted magnitude based on the
photometric zero point. The residuals are listed in one of the
columns to the right of the table (you will have to use the
horizontal scrollbar to view it).
Now that there are 6 measurements in the report table, you may wish to save the se results to a file or export them to other software such as Microsoft Excel where you might do further analysis. This simple procedure is described in Grid Controls. If you save the coordinates to a file, you can use the Import command on the Point Markers page to load the object coordinates at a future date.
By now you have doubtless noticed the scrolling Text Editor Window named Photometry Messages. This window lists results of photometry calculations and gives warning messages. The contents of the message window can be edited, printed, copied, or saved to a file.
Suppose we did not like the aperture sizes and
shapes that were used for these measurements. These can be changed
using the Aperture Tool
Window. To open the Aperture Tool, click ![]() on the Aperture Photometry Toolbar. This tool window is
a shared resource used by whichever photometry window is currently
active). When you change the aperture description, Mira
automatically re-measures and updates the report table.
on the Aperture Photometry Toolbar. This tool window is
a shared resource used by whichever photometry window is currently
active). When you change the aperture description, Mira
automatically re-measures and updates the report table.
Mira can perform other useful operations that will enhance your scientific capabilities. Here are some examples:
If measuring an image set, Plot a Light Curve.
Prepare a report for the AAVSO.
Use multiple standards to do "ensemble photometry".
Use elliptical apertures.
Remove interfering stars using the Star Removal package.
Find the time of minimum brightness for a variable star or similar object using the Kwee - van Woerden Solver.
Use File Event Scripting to do real-time monitoring, processing, and/or magnitude extraction from images are they are saved.
Perform "time series photometry" by tracking, measuring, and calibrating objects through an image set.
Copy and paste object markers from an image window with active Aperture Photometry window to another image window.
Import data from a catalog database by (column,row) or (RA, Dec). The objects can be tracked to other images, measured, and calibrated for the entire image set.
Tutorial: Doing Time Series Photometry
Fixing Header Problems in Photometric Data
Mira Pro x64 User's Guide, Copyright Ⓒ 2023 Mirametrics, Inc. All
Rights Reserved.