Tutorial: Working with Measurement Reports
This tutorial shows how to do some simple analysis of data in a Report window using table re-arrangement and the scatter plot command. Here we examine the effect a cosmic ray event has on Statistics Measurements of anImage Set.
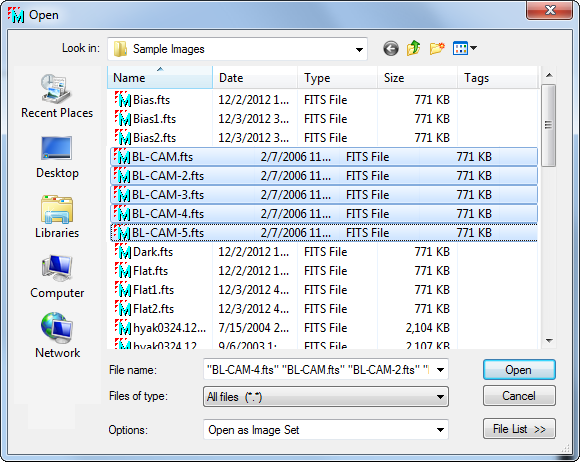
First, open an image set for the BL-CAM*.fts sample images provided with the Mira installation. Use File > Open to open the dialog below, then select all 5 images as shown:
In the Options box at the bottom of the dialog, be sure the "Open as Image Set" option is chosen so that all 5 images will be opened into a singleImage Window.
Move the Image Cursor to (column,row) position 530,299) to enclose a cosmic ray that appears in only the first image, BL-CAM.fts.
You will measure the entire image set, so be sure
the ![]() button on the Image Toolbar appears blue
as shown, which indicates "Image Set mode" will be used for
measurements.
button on the Image Toolbar appears blue
as shown, which indicates "Image Set mode" will be used for
measurements.
Click ![]() to activate
the Image Cursor. Move the Image Cursor to (column,row) position (530,299) to
enclose a cosmic ray that appears in only the first image,
BL-CAM.fts. To get the same
statistics values as in this tutorial, you should adjust its size
to 46x46 pixels either by dragging its corner or by using the
Cursor
Preferences page (Ctrl+R).
to activate
the Image Cursor. Move the Image Cursor to (column,row) position (530,299) to
enclose a cosmic ray that appears in only the first image,
BL-CAM.fts. To get the same
statistics values as in this tutorial, you should adjust its size
to 46x46 pixels either by dragging its corner or by using the
Cursor
Preferences page (Ctrl+R).
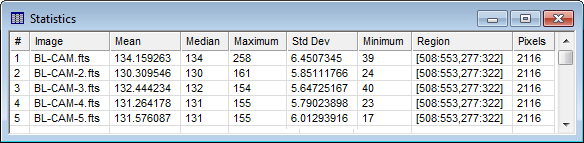
To compute the statistics for all images, click the
![]() button on the Image Toolbar. The
following table results from these measurements.
button on the Image Toolbar. The
following table results from these measurements.
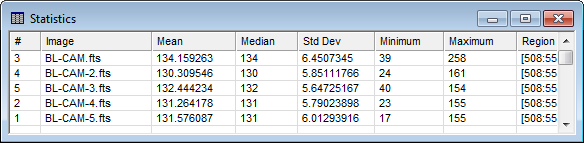
In the picture above you can see that the results for measuring 5 images. The measurement data are wider than the visible window. We could see the columns beyond the right border by residing or scrolling the table. We could click on the column separator lines and drag each column to a narrow width, but there is a better way in this situation: Use the Optimize Report Columns command in the View menu. This command shrinks all column widths to the minimum size that still shows all information. The result shows all columns within the original table width. If not, we could have left it alone or enlarged the window simply by pulling the edge or corner. Reports may be automatically optimized by checking the Auto-Optimize Report Columns setting in the Report's View menu or the Optimize Report Columns setting on the Report Window Preferences page.
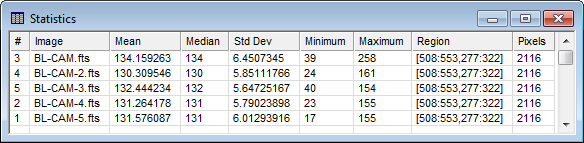
Next, we want to examine how the cosmic ray event affects the average value inside the cursor rectangle. This requires comparing the Maximum value (which shows the bright point) with the Median and Standard Deviation. To make this easy, the Maximum column will be moved between the Median and Std Dev columns to put the 3 numbers of interest together. Moving the column involves dragging the column header to a new location as described below.
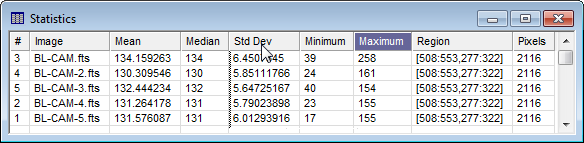
The next two pictures show the effect when you mouse down on the column header for the Maximum value. With the mouse down, when you start moving the mouse arrow, the column heading ("Maximum") turns blue to highlight itself.
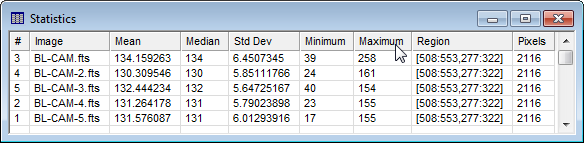
As you slide the mouse arrow to the left, the column under the arrow highlights its left border to show the drop position. In this example, you will be dropping the Maximum column between the Median and Std Dev columns:
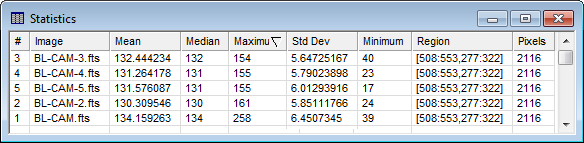
When you arrive at the drop location for the Maximum column, release the mouse button. The table is then reordered as follows:
Next, you will sort the row order by according to increasing maximum value by clicking on the Maximum column header (a sort triangle appears next to the "Maximum" column label). This shows that the highest maximum value, caused by the cosmic ray event, corresponds to the image having the lowest Median and Minimum values.
The table in the reordered state as shown above is ready to accept new measurements in the new column order. To put the rows back into their original measurement order, click the #column on the left. This column always lists the sequential order of measurement.
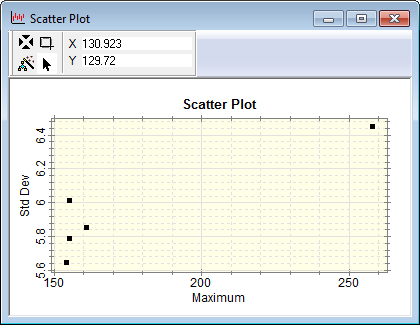
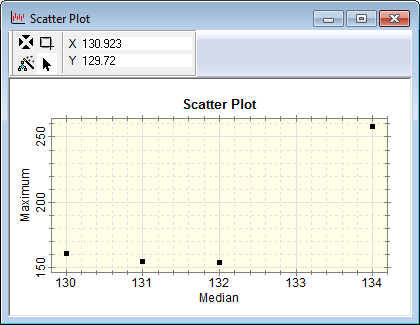
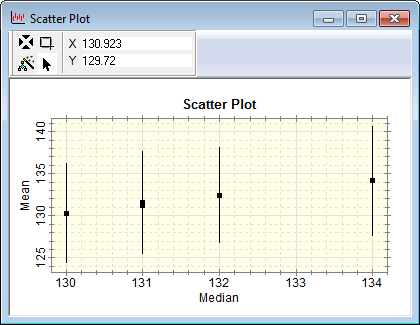
In addition to visually inspecting the table data, you could skip the column arrangements and use the Scatter Plot command to create plots like those shown below. To do this, use the procedure described in Tutorial: Making a Scatter plot of Measurements.
Contents, Tutorials, Report Windows, Arranging Report Data, Scatter Plot, Tutorial: Making a Scatter plot of Measurements