Working with Plots
In Mira , the term "plot" refers to displaying 1-D ("1-dimensional") data in the form of a 2-D graph. A special type of window exists to display and work with plots, known as a Plot Window. In working with images, plots are often created to show the relationship between image luminance and position, known as a Profile Plot (see example below), but a number of other types of plot are available within the software. Click here to view some examples of plot data.
Mira can create the following plot types from 1-dimensional data:
The Column Profile command graphs image luminance along an image column.
The Row Profile command graphs image luminance along an image row.
The Radial Profile command graphs luminance versus distance in all directions around a point in an image.
The Line Profile command graphs image luminance along an arbitrary drawn line.
The Histogram command graphs the frequency of occurrence of different luminance values.
The Pixel Series command graphs the pixel values in different images versus the sequential image number.
The Bit Histogram command graphs the frequency of binary bits in an image.
The Scatter Plot command plots two columns of data from the table in a Report Window.
Additionally, Mira supports these plot types having more than 1 dimension:
The 3-D Surface command plots display a surface representation of a 2-D image. Surface plots are generated in a 3-D Plot window rather than in a Plot window.
The Contour command plots show continuous curves that trace constant levels of image brightness. They are generated as an overlay on the displayed image and not in a Plot Window.
The Interactive Contour Plot command adds a single contour at the level where you click on the image.
Comparing Line Profile and Row Profile Plots
The intensity profile of an image can be plotted using either the Column or Row Profile command or the Line Profile tool. There are some unique capabilities offered by each method.
Comparison of Profile Plot Types
|
Property |
Column or Row Profile |
Line Profile |
Radial Profile |
|
Uses the Image Cursor to sample pixels |
|
|
|
|
Uses the mouse pointer to sample pixels |
|
|
|
|
Uses Pixel coordinates |
|
|
|
|
Uses World coordinates |
|
|
|
|
Append series from parallel pixel samples |
|
|
|
|
Append series using Copy / Paste |
|
|
|
|
Profile must be parallel to rows or columns |
|
|
|
|
|
|||
All of the profile plots show image luminance versus position or distance. For these types, Mira also provides the following coordinate system options:
Use Pixel Coordinates to measure pixel position in column or row [number].
Use World Coordinates to measure position in world units like cm, microns, or angular units of arcseconds.
To change the default setting, see Plotting in World Coordinates.
Luminance is displayed on the vertical axis of a profile plot and the horizontal axis of a histogram plot. The Luminance Axis label includes the units of luminance if the image header contains such information.
A Plot Series is a collection of data points collected together. Usually these collections are related. For example, in a Column Profile plot, a plot series is a single sample of luminance versus position along a single line. A different series might be a sample of points parallel to the first, taken along a different column. Profile plots can show a single plot series or multiple plot series from samples along other lines. When multiple series are displayed in the same Plot Window, they may be visualized in the following ways:
In Animate mode, the active plot series is displayed singly. The other series may be viewed by stepping or animating through the set using the Plot Animation Toolbar much the same way the Image Animation Toolbar steps through an Image Set.
In Overplot mode, all plot series are displayed simultaneously as an "Overplot" on the same set of axes. If only 1 plot series is displayed, this is the default mode. In this mode, the Plot Animation Toolbar is hidden.
To change the Plot Series Mode, see Changing the Plot Series Mode.
To display or save the data in the plotted series, see Working with Plot Series Data.
Adjacent lines (columns or rows) may be combined to form a single line to be plotted. The method of combining is controlled by the Plot Averaging Mode command. The name of the plot appears in the command menu from which the plot is created (see Plotting an Averaged Line).
Preferences control how the plot is created from the image. This includes, for example, whether Pixel or World Coordinates are used and what colors are used for multiple plot series. These settings are changed in the Plot Preferences page of the Mira Preferences dialog.
Attributes control the way the finished plot is displayed. You can change the axis scaling, colors, fonts, labels, tick marks, and other attributes using the pages of the Plot Attributes dialog.
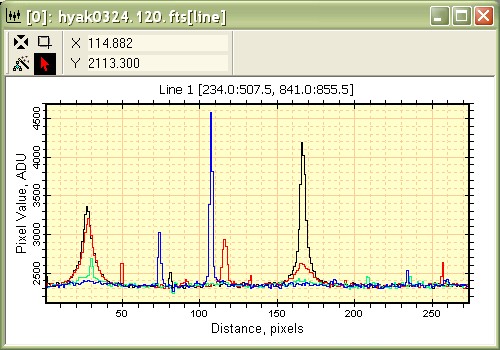
The Plot Caption is the text above the plot box and below the top window border. The Plot Caption tells you information about what was plotted. In particular, it may list the beginning and ending coordinates in (x,y) form for a Line Profile Plot or it may list the column and row range for a Column Profile or Row Profile plot. Below are some examples that show how to read the column,row range in the plot caption:
Example Regions Listed in the Plot Caption
|
[125:140, 180:182] |
Columns 125 through 140, inclusive and rows 180 through 182, inclusive. This describes 16 columns and 3 rows. |
|
[125:140, 180] |
Columns 125 through 140, inclusive and row 180. This describes 16 columns and 1 row. |
You can change the plot caption using the Labels page of the Plot Attributes dialog.
The Plot Window caption lists the image name from which the plot was created and gives an abbreviation that describes the type of plot. The plot type is abbreviated and appended to the window caption in square brackets. For example, a Row Plot is signified by [RP] appended to the Plot window caption. These suffixes appear in the window list of the Window menu and in the Multi-tab Interface along the bottom border of Mira's main window.
|
Note |
After using the Windows Copy + Paste protocol to add series to a plot window, the window caption may not accurately reflect the content of the window. You can change the caption using the Plot Attributes command. |
Plot Name Suffixes
|
[CP] |
Column Plot along a single column in one or more images. |
|
[RP] |
Row Plot along a single row in one or more images. |
|
[ACP] |
Average Column Plot along an average of parallel columns in one or more images. |
|
[ARP] |
Average Row Plot along an average of parallel rows in one or more images. |
|
[Line] |
Line plot along a general direction. |
|
[Hist] |
Histogram Plot |
|
[Rad] |
Radial Profile Plot |
|
[3-D] |
3-D surface or wireframe plot of the rectangular region inside the image cursor. |
|
[Series] |
Pixel Series Plot for pixels in a series of images. |
|
[BitHist] |
Bit Histogram Plot. |
Plot Windows, Plotting Commands, Plot Coordinate System, Plotting an Averaged Line, Working with Plot Series Data, Scatter Plot